
Cortex uses GateRook’s Prometheus connector. Set the tenant when the cluster serves several.
The screenshots show GateRook 2.0.0: the Cortex form, the endpoint selector, and this connector’s actual tool preview. The form and preview have not been saved. Select a screenshot to open it at full size.
1. Create a connection and enter the settings
In GateRook, open Connections, select Add connection, search for Cortex, choose its card and select Continue to configure.
Get the Cortex query gateway URL, authentication requirements and the tenant ID used when metrics are written. The read API must be reachable from the GateRook computer.
Cortex supports Prometheus-compatible querying, but the deployed gateway can add its own URL prefix and access rules. Copy the operator-provided query address.
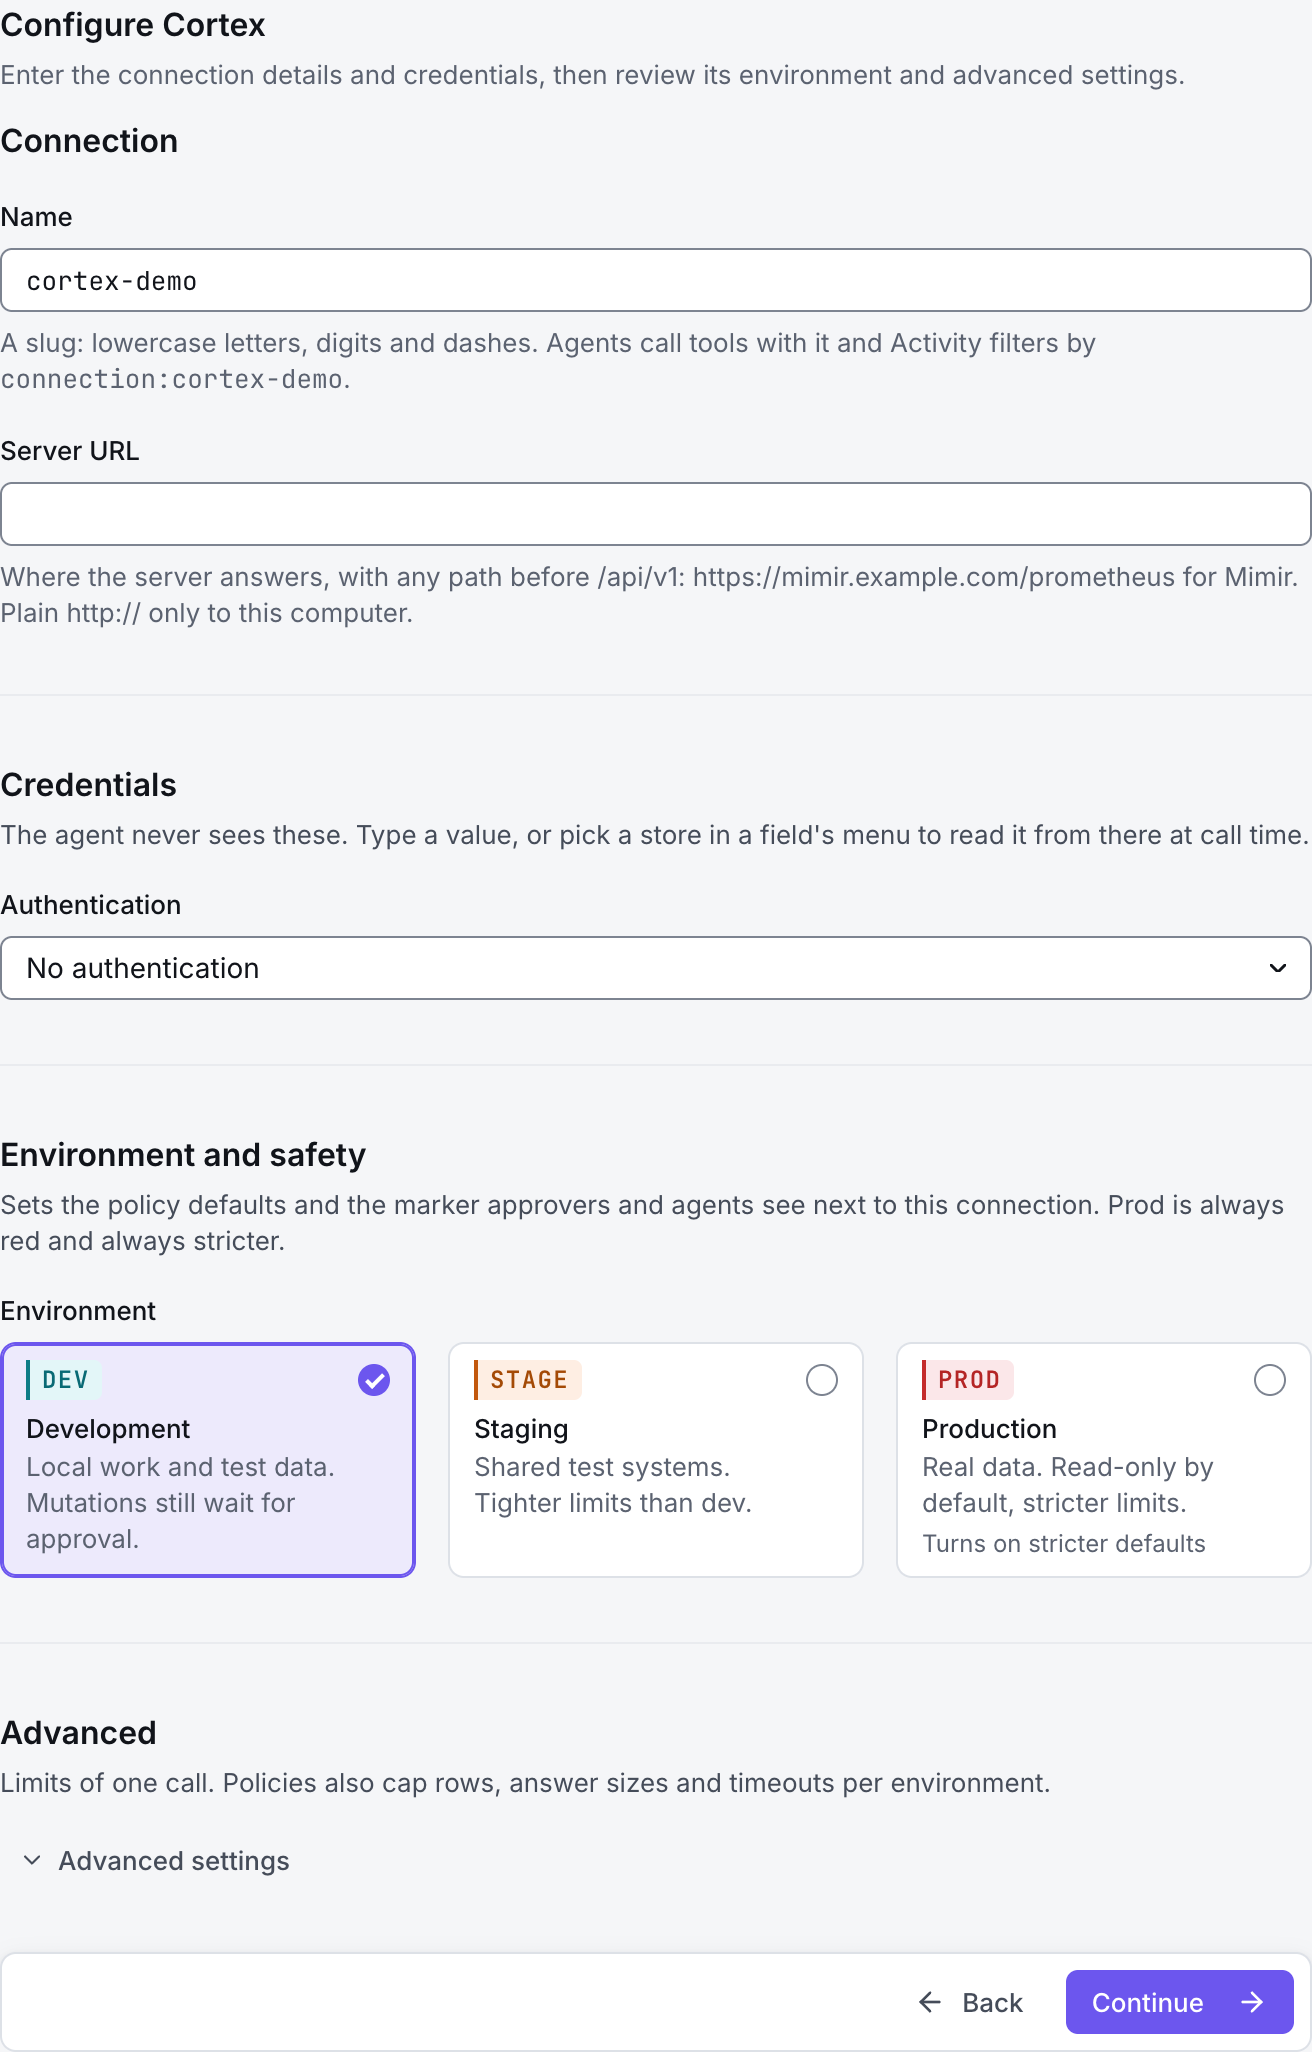
Enter a Name, for example cortex-demo. Your AI app uses this name to choose the connection.
Fill Server URL with the query base before /api/v1, including the deployment's Prometheus HTTP prefix, commonly /prometheus.
Enter the tenant in Tenant (X-Scope-OrgID). Choose the configured Authentication method and supply Username and Password or Bearer token as appropriate.
Add a private CA certificate (PEM) if the gateway needs one. In Advanced, keep query answer limits appropriate for the intended analysis.
Choose Development, Staging or Production to match the service. Review the connector’s limit and access settings before continuing.
PromQL and label APIs use the query endpoint. Rule and alert APIs require enabled ruler routes on the configured base URL; do not infer their availability from a successful query.
2. Test the connection and add it to an endpoint
Select Continue to test. GateRook checks the settings from your computer. Review the result and resolve any connection, certificate or permission error before continuing.
Check the prefix if the server returns a route error, and check that the tenant header matches the tenant used at ingestion if queries return no expected data. The HTTP gateway's login and Cortex's tenant selection are separate checks.
After the test passes, select Continue to add to an endpoint. Choose the endpoint your AI app uses, review its tool modes, then select Save connection. GateRook offers default as the starter endpoint.

3. Use the connection from your AI IDE
After saving Cortex on the endpoint and passing its connection test, ask your AI app to use cortex-demo, or the name you chose. If its tools are missing, confirm the endpoint assignment and refresh the MCP connection or start a new chat.
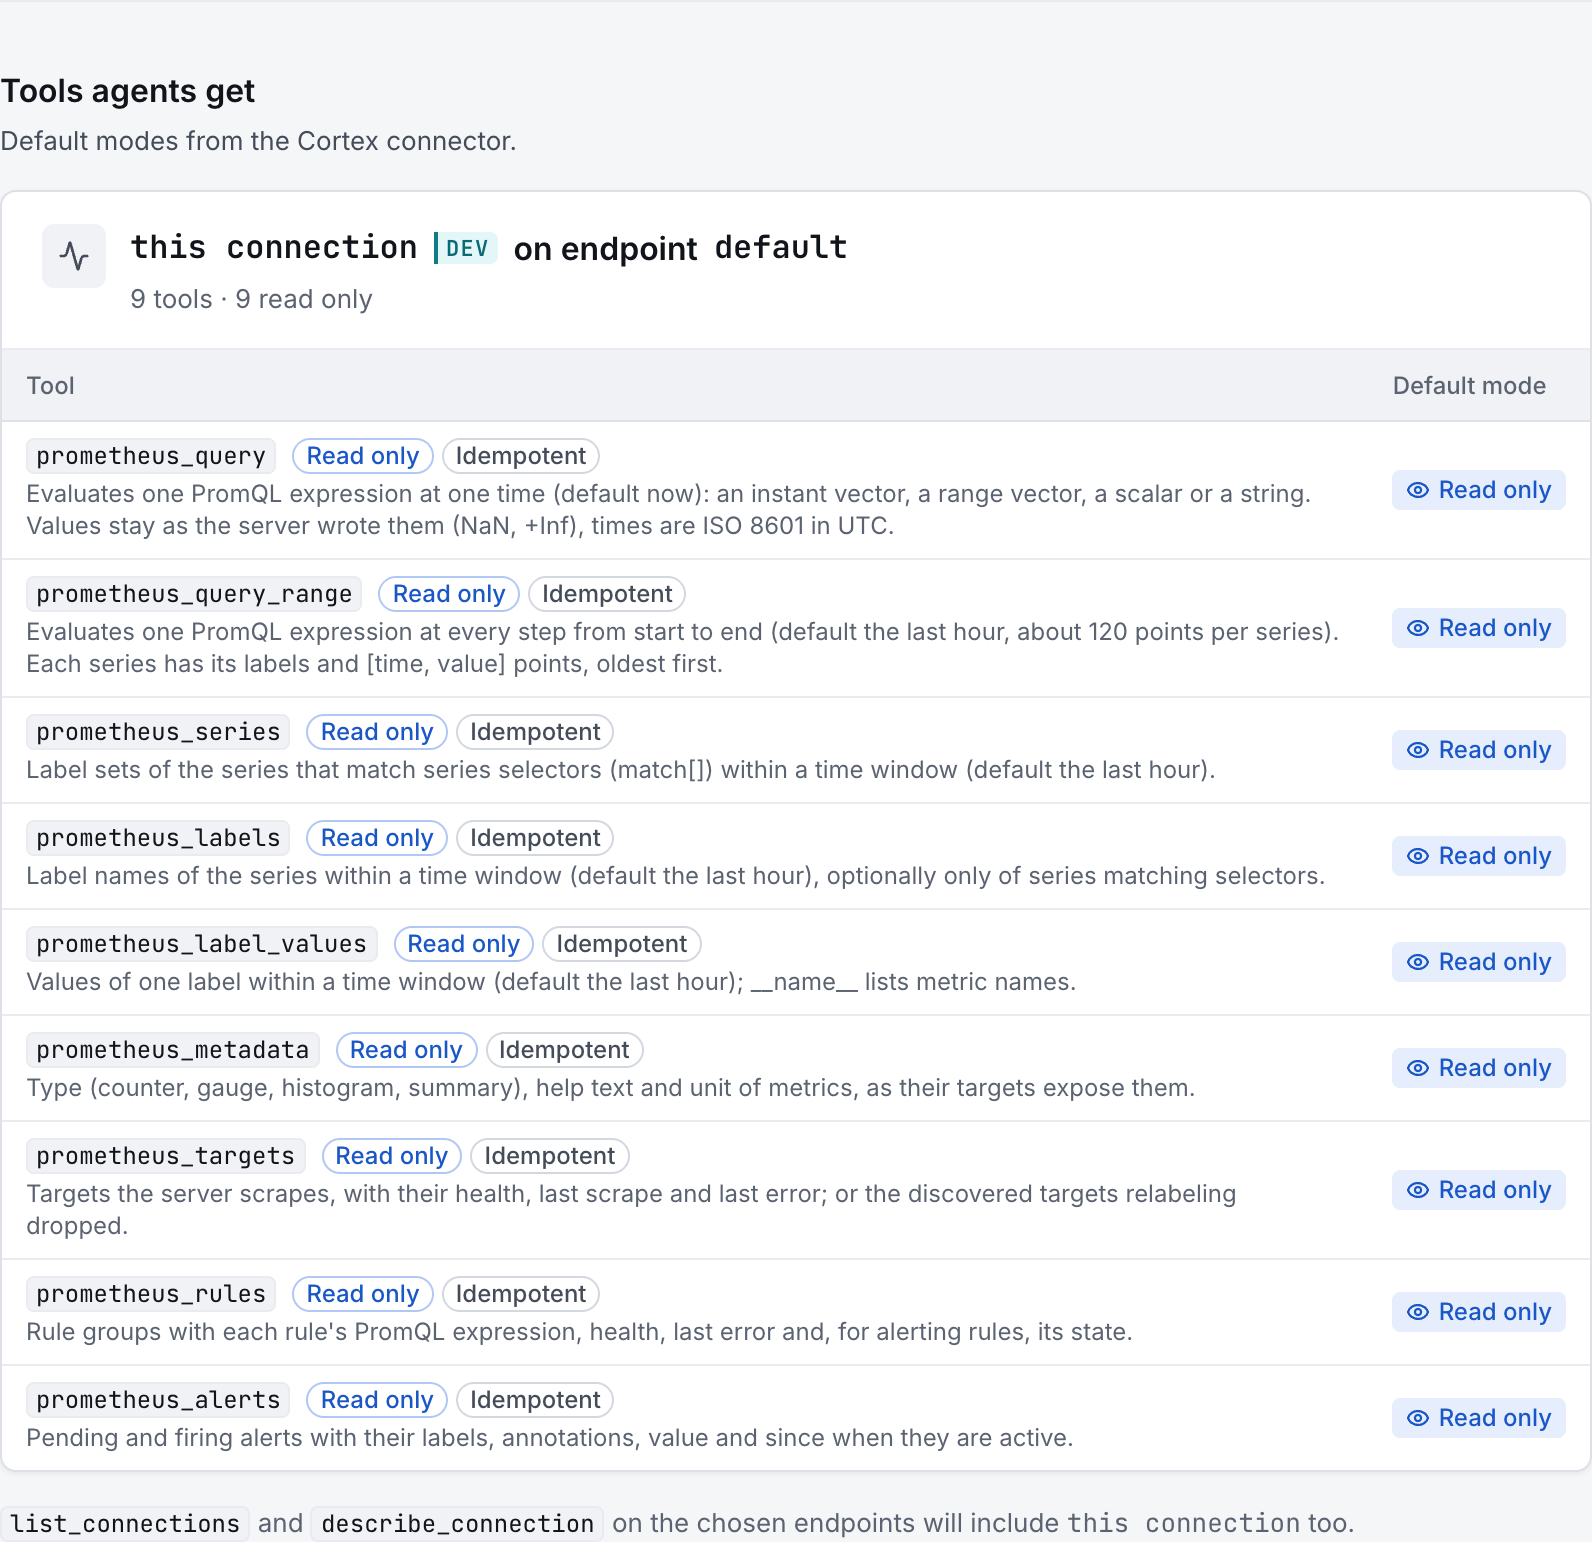
The preview below shows this connector’s default tools before saving. The table explains what each tool can do; connection settings, credentials and endpoint policies can restrict access further.
Start with a small read request. Replace example resource names with existing resources your connection may access. Open Activity after the call to inspect its connection, tool, arguments, policy decision and result metadata.
Ask your AI, for example
- “Run an instant query for up and group the result by job.”
- “Show the up metric over the last hour with a five-minute step, keeping the result bounded.”
- “List the metric names available for one selected job and suggest a small health-check query.”
| Tool | What it does | Starts as |
|---|---|---|
prometheus_query | Evaluates one PromQL expression at one time (default now): an instant vector, a range vector, a scalar or a string. Values stay as the server wrote them (NaN, +Inf), times are ISO 8601 in UTC. | Read only |
prometheus_query_range | Evaluates one PromQL expression at every step from start to end (default the last hour, about 120 points per series). Each series has its labels and [time, value] points, oldest first. | Read only |
prometheus_series | Label sets of the series that match series selectors (match[]) within a time window (default the last hour). | Read only |
prometheus_labels | Label names of the series within a time window (default the last hour), optionally only of series matching selectors. | Read only |
prometheus_label_values | Values of one label within a time window (default the last hour); __name__ lists metric names. | Read only |
prometheus_metadata | Type (counter, gauge, histogram, summary), help text and unit of metrics, as their targets expose them. | Read only |
prometheus_targets | Read the scrape-target API when the configured endpoint exposes it. Compatible remote query services may not provide this API. | Read only |
prometheus_rules | Read recording and alerting rules when the configured endpoint exposes the Prometheus-compatible ruler API. | Read only |
prometheus_alerts | Read pending and firing alerts from the Prometheus-compatible alert API when it is available at the configured endpoint. | Read only |
You can change each tool’s mode on the endpoint. Every call your AI makes appears in Activity.